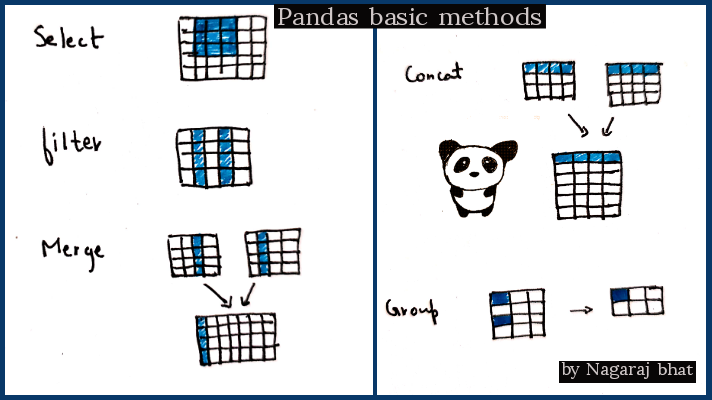
Picture Pandas - Little Intro guide (Olympics data)
Pandas is a python library for data analysis and manipulation.
- This post is not a complete guide to pandas. For a more comprehensive guide, you can take this kaggle course
- This is also not a complete Exploratory data analysis of the Olympic dataset.
- Rather it is a little intro guide covering some basic operations in pandas, with an approach of asking the questions as you explore the data.
Frame the question approach
So the idea is you are given a dataset, but more often than not it is not the ideal dataset that you can use directly in the machine learning pipeline. You need to get it as close to the ideal state as possible. And the way to do this is to ask questions to your dataset. Ask questions so that you get answers from the dataset and transform that dataset into something that can be used to get results. And the questions depend upon what results you want, or what your end goal is.
Also, note that the questions don't necessarily have to come first. More often than not exploring the data, and combining different operations can give rise to a solution that can answer a question. So it is hard to tell whether the chicken came first or the egg.
Eventually, the end goal is to make a dataset that is much more useful in the context of that is set out to be solved.
Dataset
The dataset considered here is of 120 years of Olympic history athlete and results. Download this dataset if you want to follow along.
What will be covered?
- Read and select data
- Summary statistics
- Group and sort data
- create DataFrame
- Combine data (merge, concat)
Pre- requesite
- Basic python knowledge
- Jupyter notebook setup
- Install pandas (pip install pandas)
#dependencies
import pandas as pd
1. Read
To read the data, we can use either read_csv or read_excel depending on the data file format.
#load dataset
df = pd.read_csv('./data/athlete_events.csv')
#head() displays the top rows
df.head()
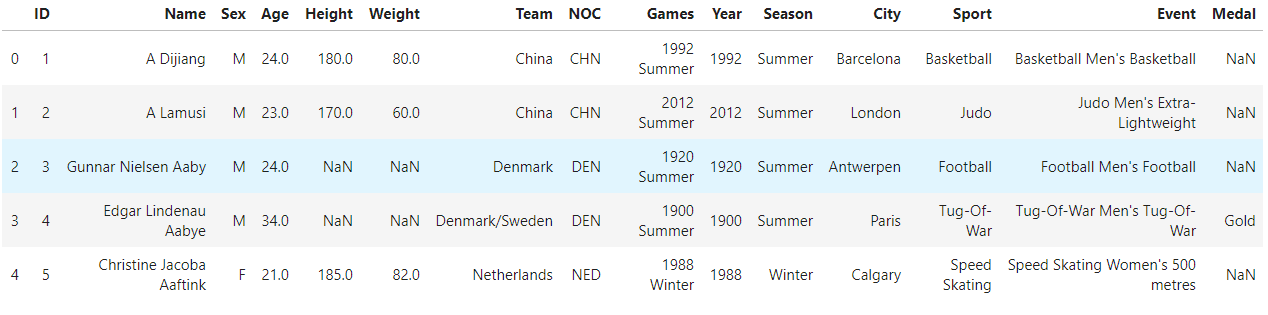 Fig: Olympic athlete events dataset
This dataset has the athlete performance for all the Olympic events held to date. Note that the loaded dataset is of type DataFrame.
2. Select
In most cases, we do not require the complete dataset. We only need a portion of the dataset for analysis, hence we “select” the data.
 Fig: Select data
There are two methods to select - iloc and loc
iloc is to select rows and columns using numerical constraints.
format is dataframe.iloc[x,y]
# select
df.iloc[1:3,0:2]
df.iloc[1:3,2:5]
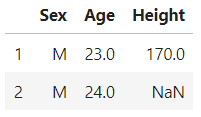 Fig: A portion of dataset is selected using iloc
loc can be used to specify rows/column names, very handy while specifying certain columns
df.loc[1:5,['Age','Team']]
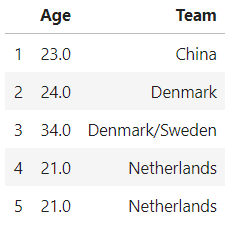 Fig: selecting data using loc
Conversely, We can also use pandas filter() method If we want to filter certain columns
 Fig: filter specific columns
df.filter(['Age','Medal','Team'])
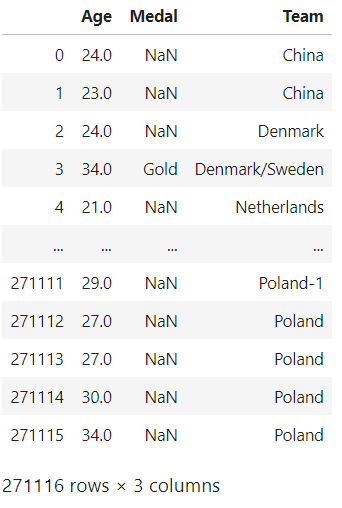 Fig: filter age, medal, team
There is another way to select wherein we can also give conditions for the selection.
suppose we are interested in number of Gold,silver and bronze medals by old people in Italy - question
df_Italy_old = df.loc[(df.Team=='Italy')&(df.Age>=40)] #and - both conditions have to be true
df_Italy_old['Medal'].value_counts()
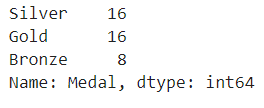 Fig: value count of medals by people over 40 from Italy
As we can see people above 40 from Italy have won 16 Gold medals.
3. Summary statistics
Summary stat gives us a quantifiable description of the data.
You might have encountered it in your high school statistics class.They include count,mean,median,mode,standard deviation, etc.
We can obtain a summary stat of a dataframe using the “describe” method.
df.describe()
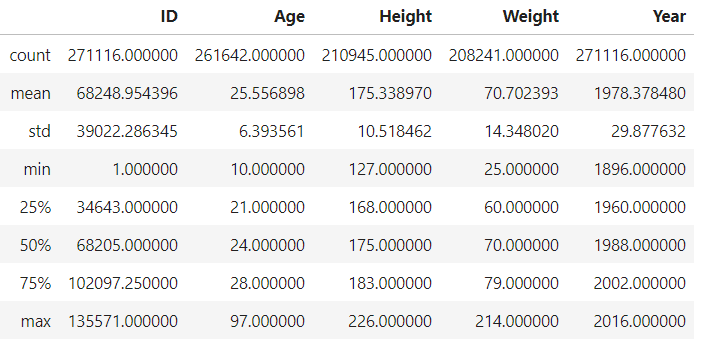 Fig: Summary statistics
- As we can observe only the columns with int/float as their types are displayed in summary stat.
- notice that count for fields height, weight, and age are less than the id. Indicating missing values in those fields.
One thing to remember is that the median is a better representation of the center than mean if the data contains too many extreme values/outliers. For example in the data, the max age of a person is 97 years old, this might affect the mean value but does not affect the median value.
Also, an individual summary stat can also be found by using mean(), count(), and other functions -
df.Age.mean()
25.556898357297374
df.Height.median()
175.0
4. Group and sort values
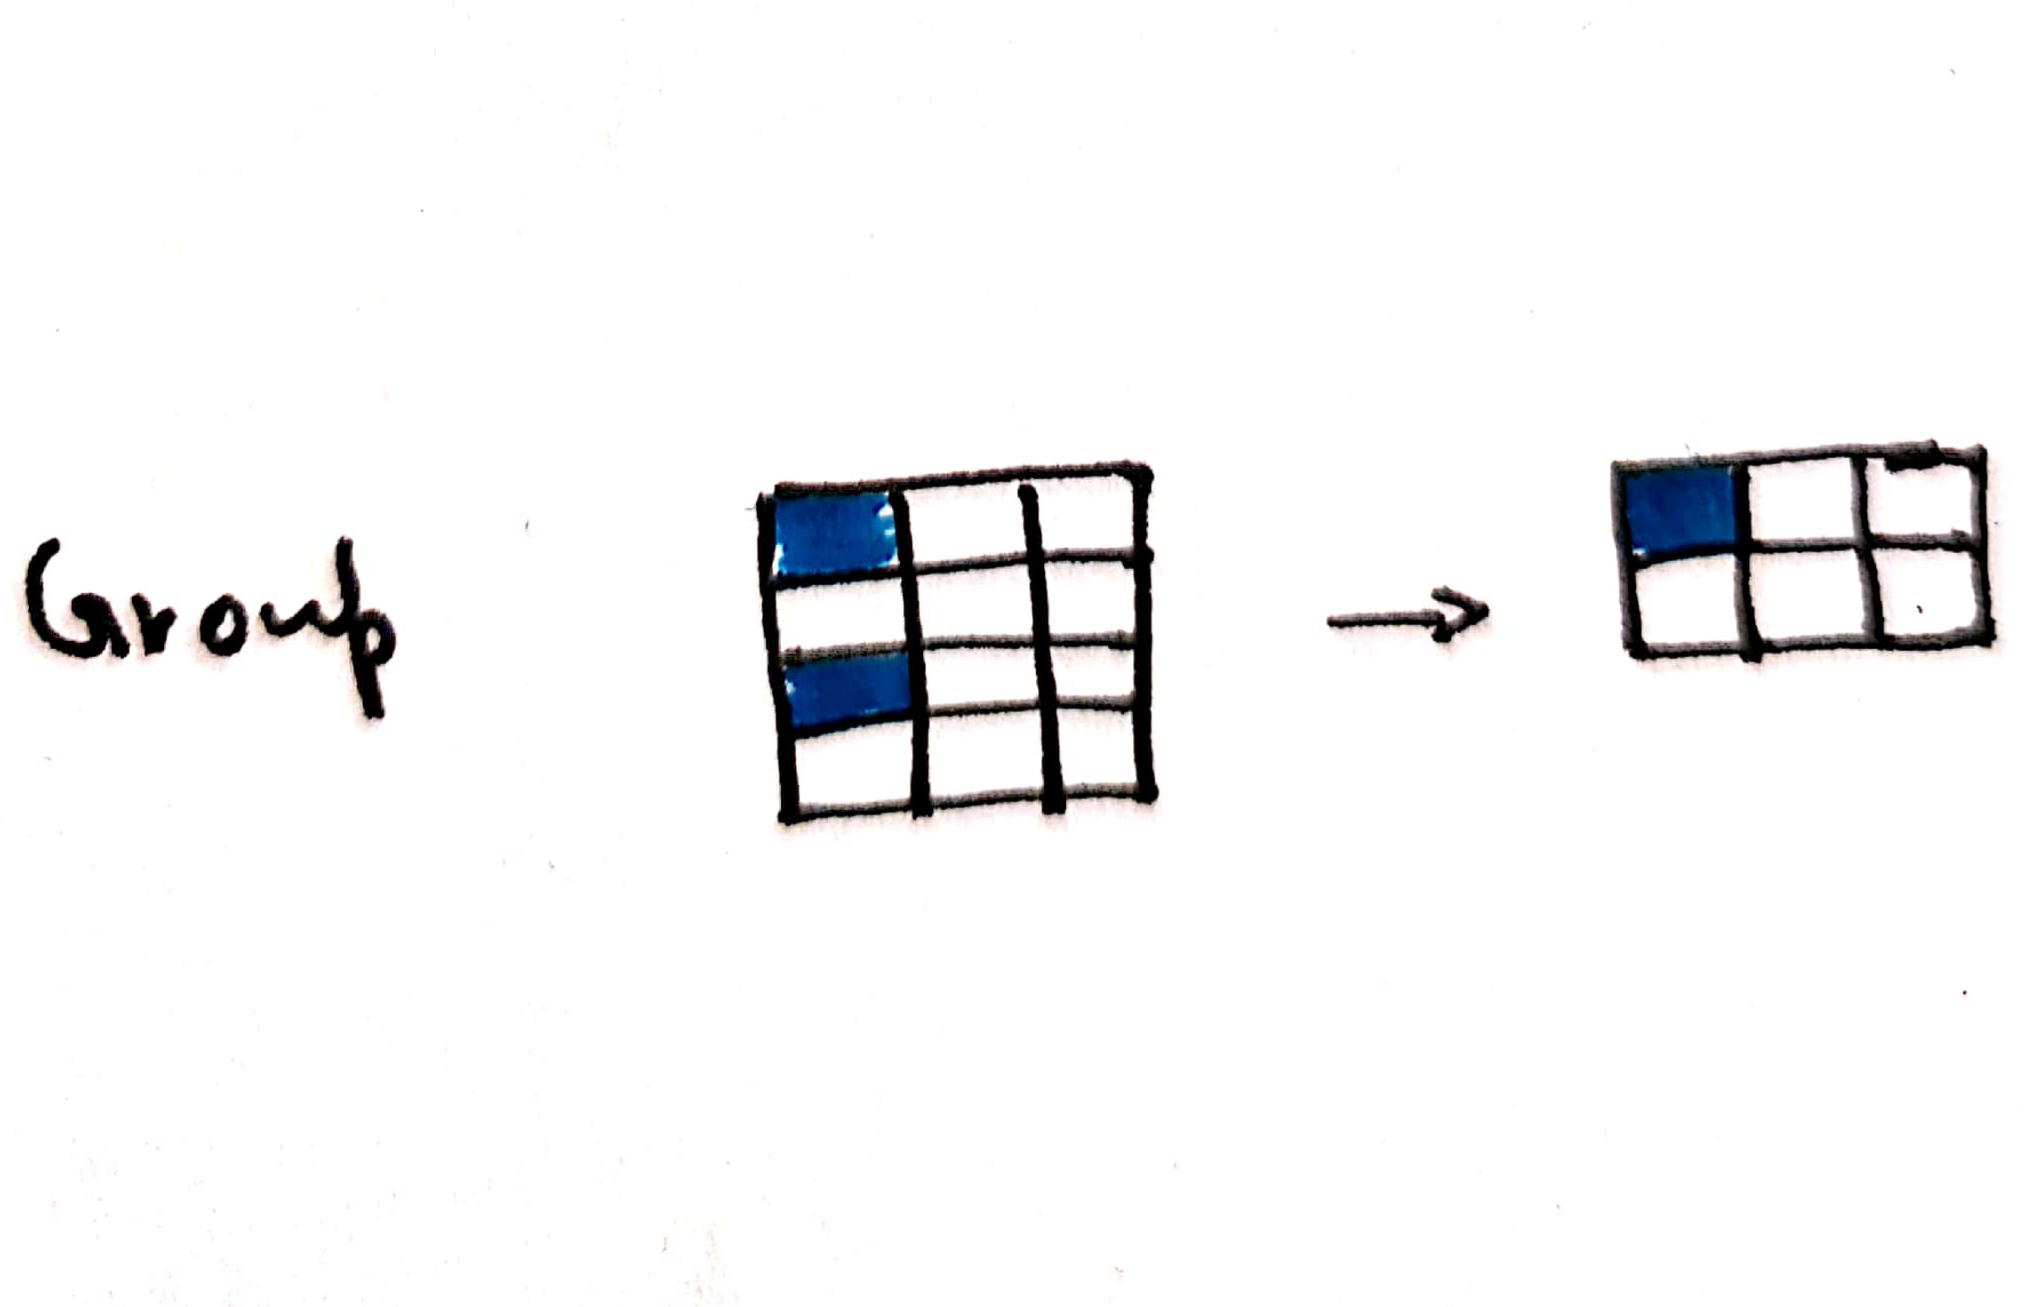 Fig: Grouping the data
Sticking with the medals brought in by aged people in the olympics, If we were to extract the information of countries with the highest medals by aged people, how would we go about it?
- first, select people above 50
- then, filter only the columns ‘Team’ and ‘Medal’
- then use groupby() function to group the data based on ‘Team’
- Since we need the count to the medals, use count() function(). Other criteria include mean(), median(), sum(),etc
- sort the values using the key ‘Medal’ in descending order. Sorting can also be done using multiple keys.
- and Finally, display the top ten countries
We can join all these methods together in the following manner -
df_old_people = df[df.Age>=50]
df_old_people.filter(['Team','Medal']).groupby('Team').count().sort_values('Medal',ascending=False).head(10)
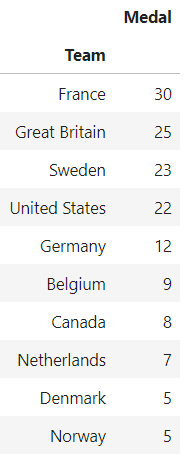 Fig: Teams with most medals from aged athletes(above 50 years)
We notice that France tops the list of countries when it comes to medals by aged people!!
Now let us try to explore France, and see which athlete above 50 has the highest medals
df[(df.Team=='France') & (df.Age>=50)].groupby('Name').count().sort_values('Medal',ascending=False)
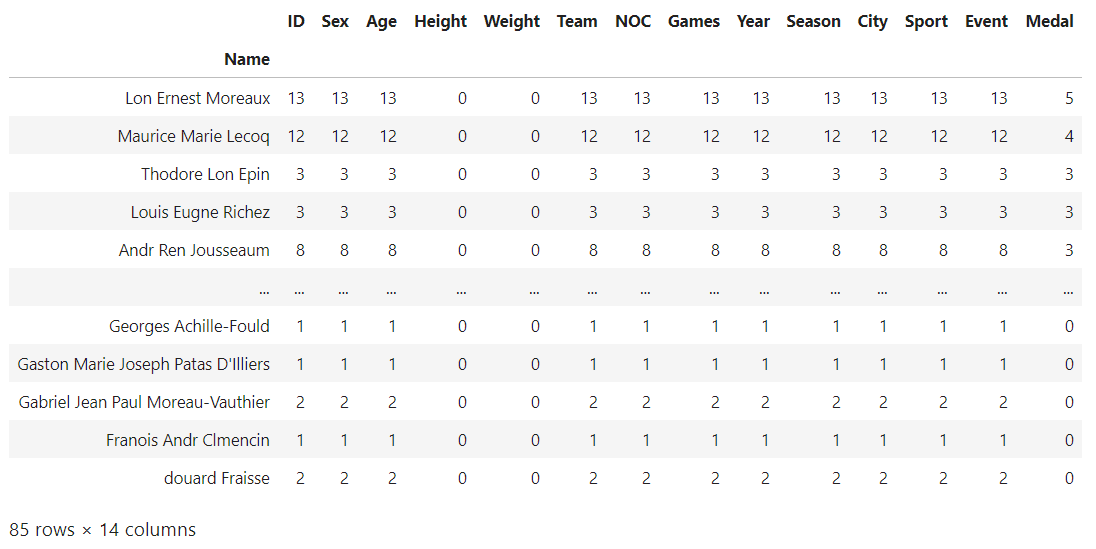 Fig: Aged athletes(above 50 years) with most medals for France
It is a shooter named Lon Ernest Moreaux! Here is more information about this particular athlete's performance
df[(df.Age>=50)&(df.Name=='Lon Ernest Moreaux')]
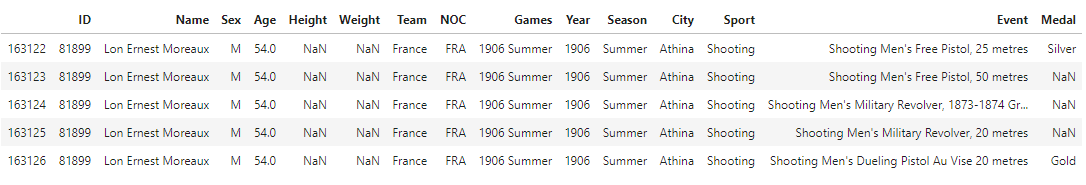 Fig: Details about Lon Ernest Moreaux
Create dataframe
We have learned how to read an existing dataset, but what if we wanted to create one from scratch?
So we'll leave the Olympics dataset behind and begin by creating dataframe from scratch, further using new dataframes for Combining operations.
#we need numpy to create an array
import numpy as np
df2 = pd.DataFrame(np.array([[1,2,3],[3,3,5]]),columns=['a','b','c'])
df2   # original dataframe
 Fig: df2
Combine
There are two methods to combine the dataframes - merge and concat.
Merge
Merge is used to combine two dataframe with a common column.
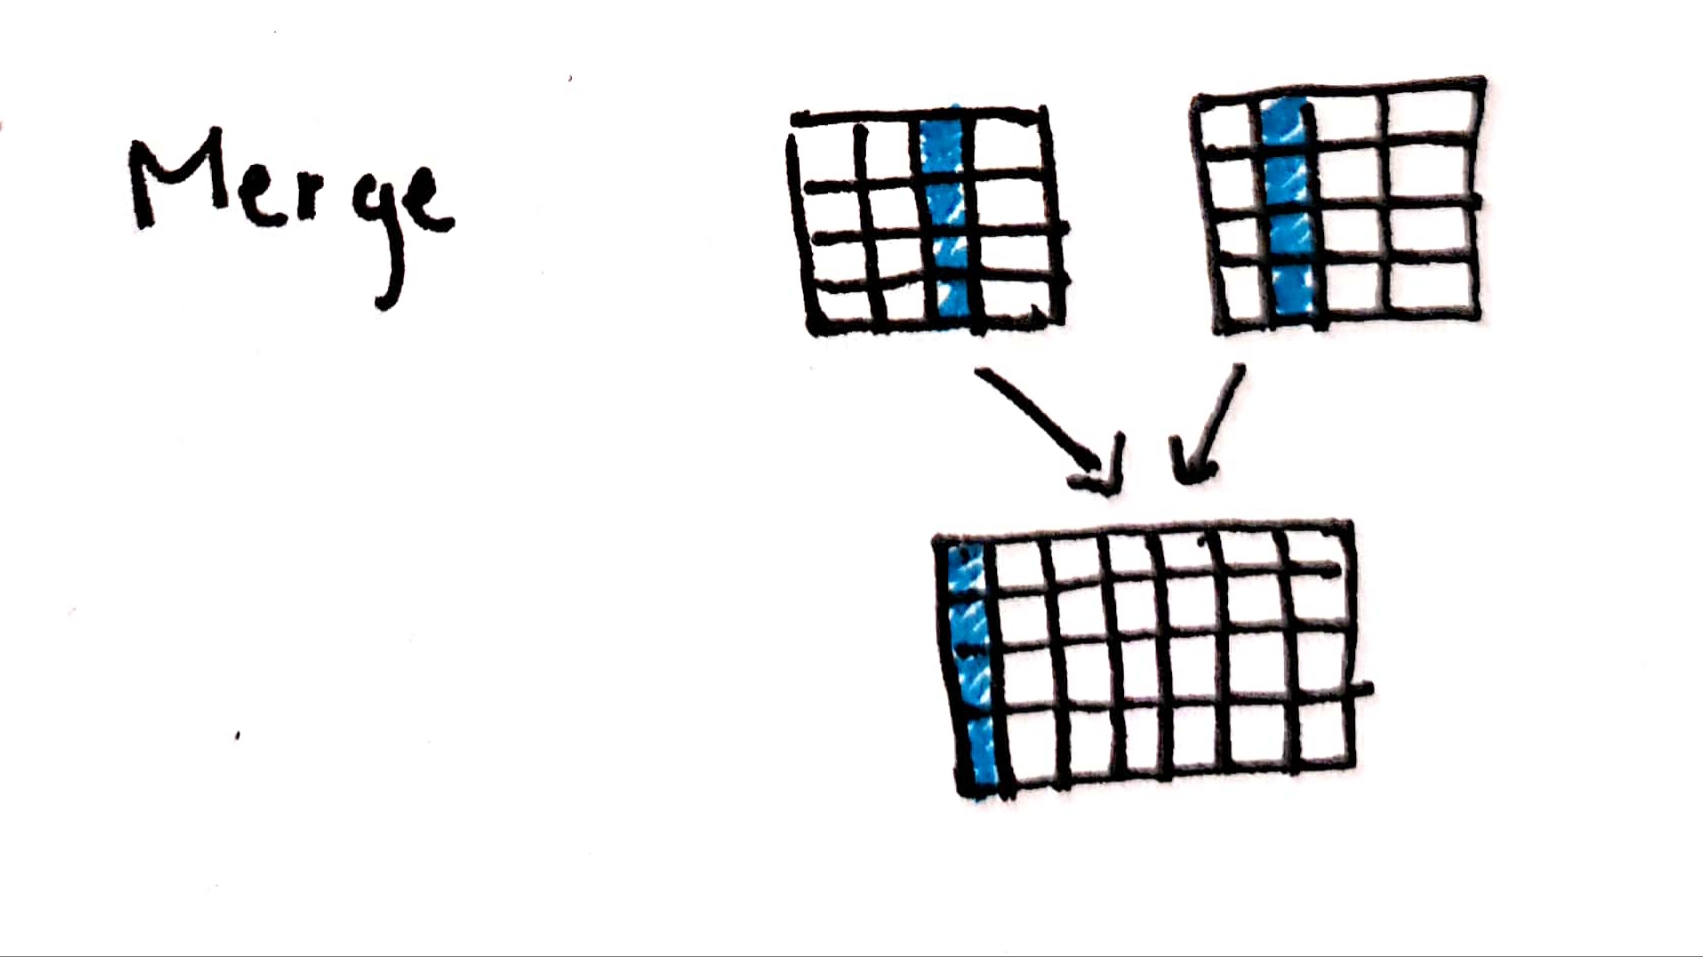 Fig: Merge the data
Let us create a dataframe df3.
df3 = pd.DataFrame(np.array([[2],[3]]),columns=['e'])
df3 # dataframe to be merged
 Fig: df3
Notice column values for ‘b’ and ‘e’ are same, hence we can merge them in the following way -
df4 = df2.merge(df3,left_on='b',right_on='e',how='left')
df4 # merged dataframe
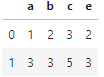 Fig: df4
‘left’ indicates left outer join
Concat
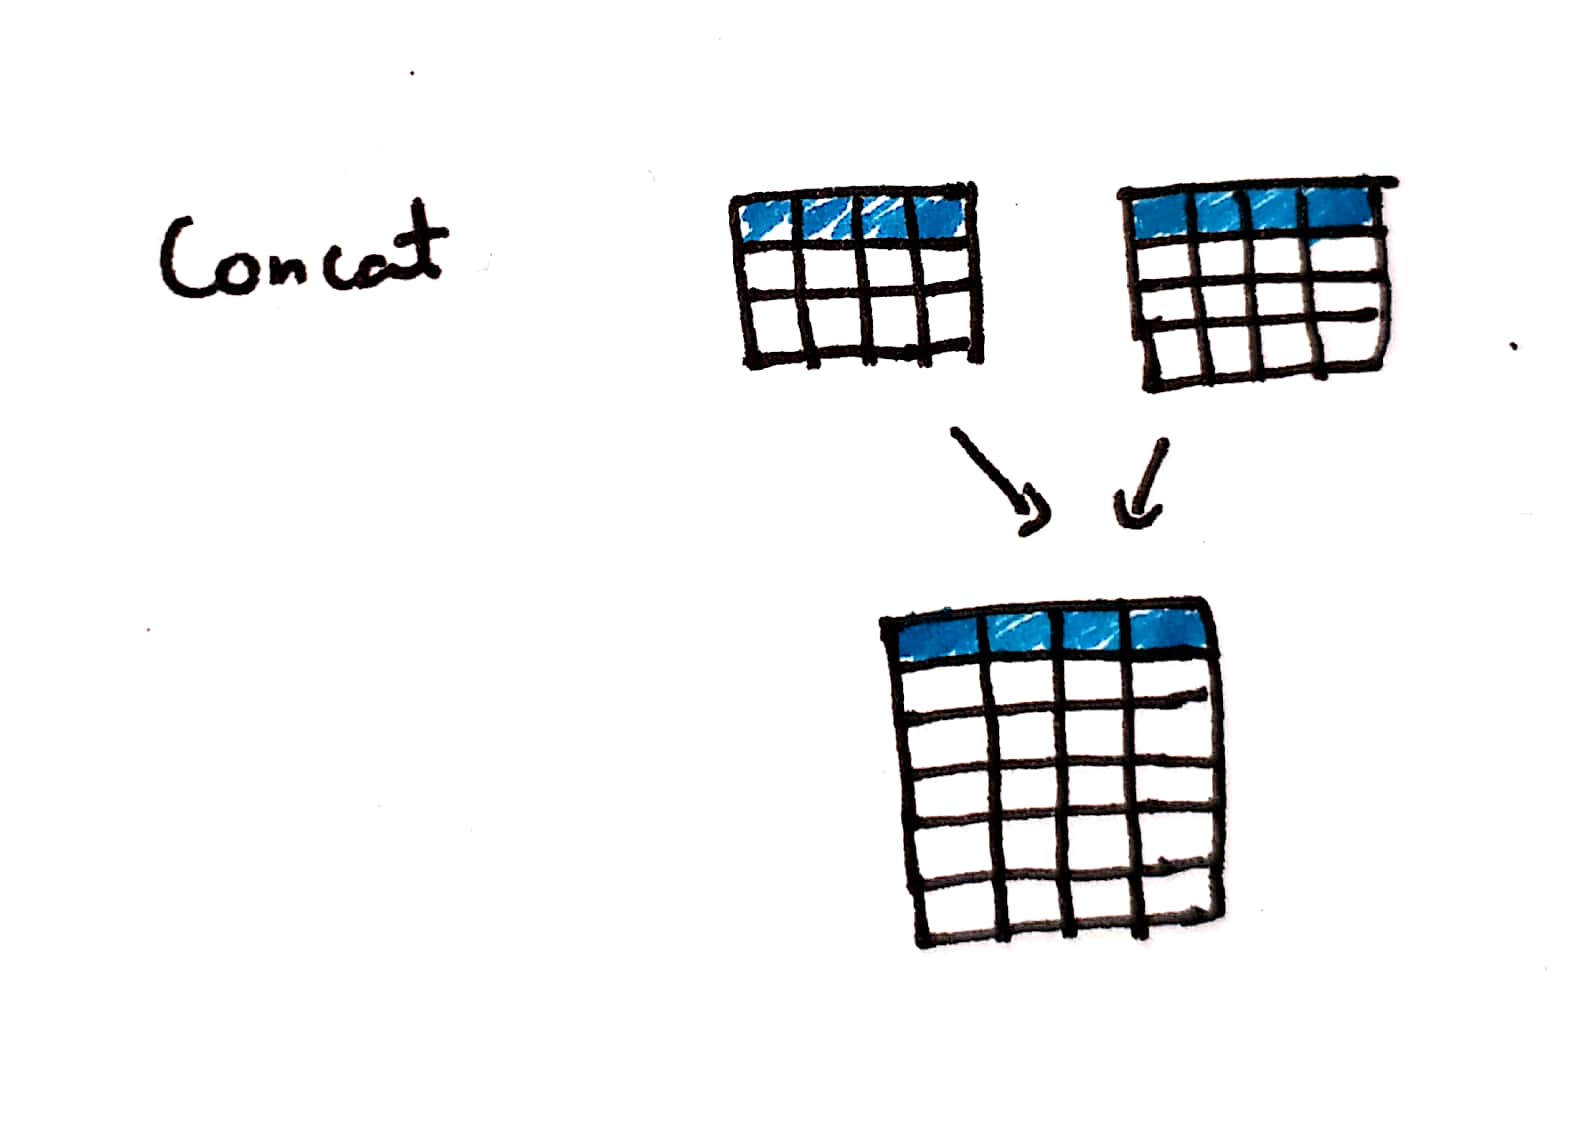 Fig: Concat the data
Concat is used to add additional rows to the existing dataframe, notice that column names should be the same to concat.
Let us create a dataframe df5.
df5 = pd.DataFrame(np.array([[5,7,8]]),columns=['a','b','c'])
df5 # dataframe to be concatincated
 Fig: df5
Now we can concat df2 and df5 based on same columnn names.
df6 = pd.concat([df2,df5])
df6 # concatinated dataframe
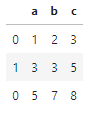 Fig: df6
Conclusion
- We have learned how to use key pandas operations such as read, select, group, select, merge, concat.
- We learned how operations can be chained together to answer complex questions.
- We figured out which countries have the most medals brought in by aged people.
Where to go from here?
- Explore how you can handle missing values(Nan)
- learn about map and apply functions.
- Take a look at the official user guide to explore further.
This is a part of my #100daysofcode challenge, check out the github repo here .
Nagaraj Bhat
Master of data analytics
I build awesome ML products. Interests - Python, Machine learning, and poetry.