Avatar

Nagaraj Bhat

Master of data analytics

Deakin University, Melbourne

About me 🔍

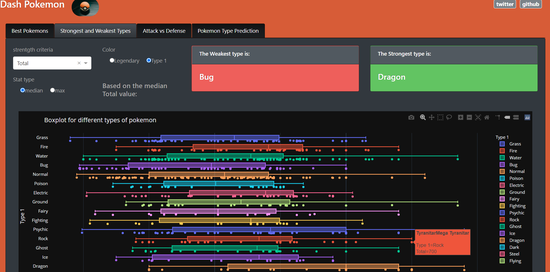
I am passionate about building awesome Machine learning products. Skilled in Python,Data visualisation and Machine learning. I've previously worked as a software Engineer building websites in Django,flask.

I am currently participating in the #100DaysOfCode challenge, where I share my coding journey, Check out my progress here.

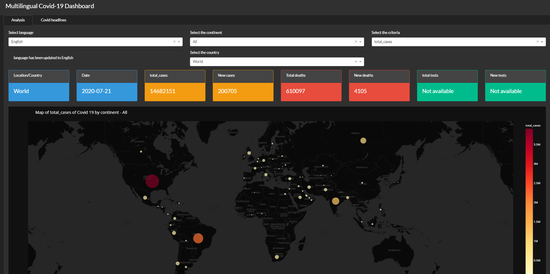
I am also working on a Multilingual COVID-19 Dashboard built using plotly Dash and MarianMT transformer. It also has a news feed that can be filtered using category, country. It also trended on subreddit r/dataisbeautiful with over 8k upvotes - link to the post

Feel free to contact me if you would like to collaborate, hire me , have any questions or just want say Hi! 👋

Interests

  • Machine learning 🤖
  • Poetry ✒
  • Short movie making 🎥
  • Pink Floyd, Beatles 🎸

Education

  • Master of data Analytics, 2019

    Deakin University, Melbourne

  • B.E in Computer science, 2016

    VTU, Bangalore

Projects 🚀

Multilingual COVID-19 Dashboard

A Multilingual COVID-19 dashboard built using Plotly Dash and MarianMT Transformer.It also has a news feed buillt using Newsapi.

Dash Pokemon

A pokemon dashboard built using Plotly Dash. For visual analysis and pokemon type prediction. Can be useful for Pokemon related gaming.

Refresh Quotes

A Simple Flask app that displays random quote everytime you refresh the page.

Blog ✏

KNN for classification (of glass types)

Explained KNN, used it to classify glass type. Covered pairplot,feature scaling, finding the best k value

Picture Pandas - Little Intro guide (Olympics data)

A small intro guide for python's pandas library using olympics data

Australian bushfire - Map analysis

The Australian bushfire has led to a massive loss to wildlife, forest area and has even caused human casualties.We will take a look at …

Interactive Map of Hospitals in Victoria using Python

There are 325 hospitals in victoria. We will visualize them in the map such that some insights can be extracted.

Python's Folium to create choropleth maps

Folium is python library built on top of leaflet.js. It is used to visualize data through interactive maps, choropleth visualization, …

Skills

Python

Statistics

Git

Golang

Machine learning

Data visualisation

Plotly Dash

pandas

folium